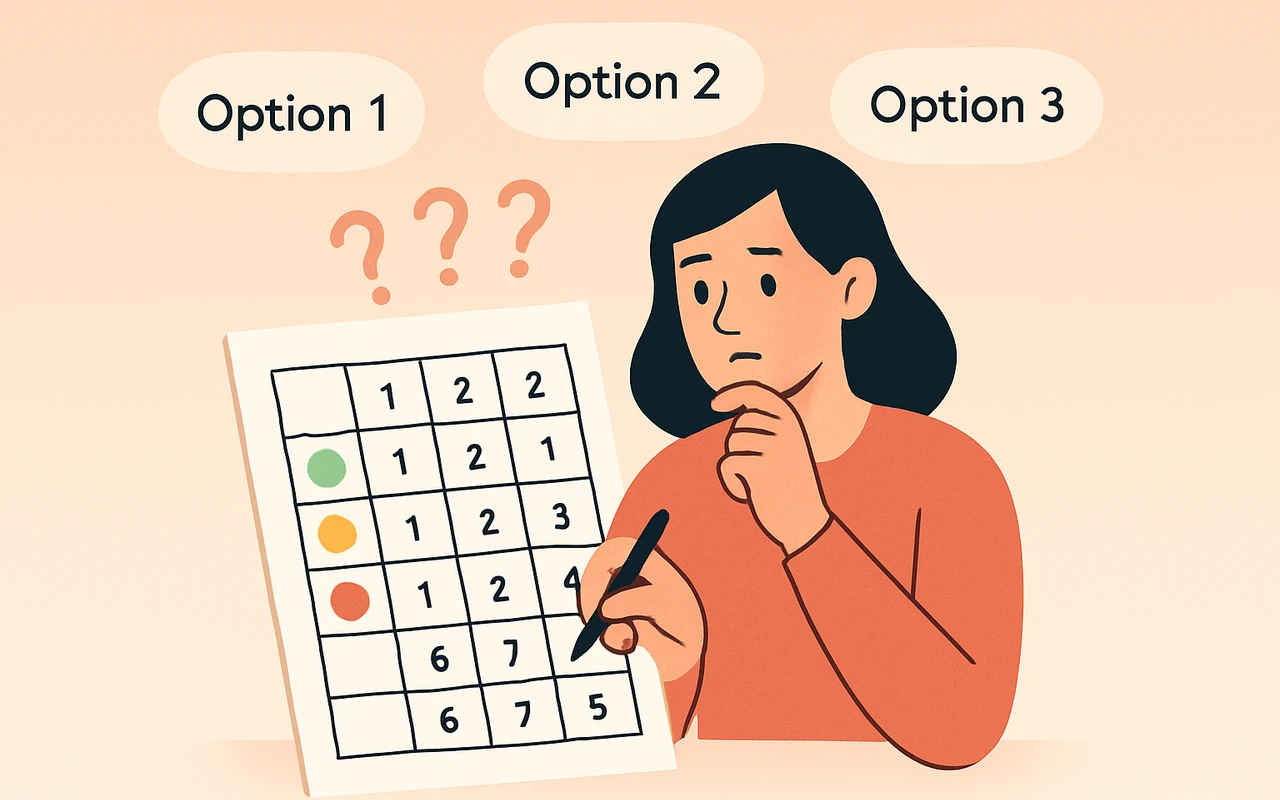
When you face three or more options, a simple pro-con list stops working. A decision matrix is a grid that scores every option against the same criteria, so the comparison is visible and the result is not a gut feeling.
This article explains how the method works, how to run it in practice and where it falls short.
What a Decision Matrix Is and When to Use It
A decision matrix, also called Grid Analysis or Pugh Matrix Analysis, is a table that organizes and weighs choices. It is based on Multiple-Criteria Decision Analysis (MCDA), a family of methods for choosing among options using several factors at once. Mindtools also lists Multi-Attribute Utility Theory as another name for it.
The layout is simple: options go in rows and criteria in columns (some tools flip this, and it makes no difference). Each cell holds a score, and the highest weighted total points to the best option.
It fits best in these cases:
- You have more than two options, so a pro-con list is awkward.
- Several factors can be quantified, such as price, battery life or delivery time.
It is less suited to decisions that are hard to put into numbers, such as choices driven mostly by personal values.
How to Build and Score a Matrix
The steps below follow the common version of the method.
- Write down the decision. State it as one clear question.
- List the options. Three to seven usually works best. Fewer limits your choice, while more can cause cognitive overload and analysis paralysis. Some writers suggest narrowing to two or three strong options when the stakes are high, to avoid decision fatigue.
- Pick the criteria. Four to eight factors that are independent and measurable work well. Avoid two criteria that really measure the same thing, because that double-counts it.
- Weight the criteria. Give more important factors a higher weight.
- Score each option. Rate every option on every criterion.
- Multiply and total. Multiply each score by its criterion weight, add the results per option and pick the highest total.
Choosing a Scoring Scale
Guidance varies, but the logic is consistent. A 1–5 scale suits a smaller set of options, and a 1–10 scale gives more room when there are many. One guide suggests a 1–3 scale when options are close, since finer scores can create false precision.
A Worked Example
Untools compares three design tools: Sketch, Figma and Framer. After scoring each on several factors and applying weights, Framer wins with 44 points.
Here is a smaller, invented example for choosing a phone. Suppose price has a weight of 3, battery 2 and camera 1, with scores from 1 to 5:
- Phone A: price 4, battery 3, camera 5 = 12 + 6 + 5 = 23
- Phone B: price 3, battery 5, camera 4 = 9 + 10 + 4 = 23
- Phone C: price 5, battery 2, camera 2 = 15 + 4 + 2 = 21
Phones A and B tie. That is useful information: the matrix shows the choice is close, so the tiebreaker should be a factor you have not yet listed or a closer look at your weights.
Quick Version: The 3x3 Matrix
For fast calls, a 3x3 matrix uses three options and three criteria. One example for choosing a home location weights proximity to transport at 50%, amenities at 30%, and size and cost at 10% each. The heavy weight on one factor makes clear what matters most.
Handling Conflicts, Bias and Tools
Criteria often conflict, such as cost against quality. Decide up front which criteria are deal-breakers and which are flexible. An option that fails a deal-breaker should be removed before scoring, not offset by high scores elsewhere.
A matrix does not remove judgment. Your weights and scores are still opinions, and it is easy to tune them until your favorite option wins. To guard against this, set the weights before scoring and consider changing them slightly to see if the winner holds. If a small change flips the result, the options are effectively tied.
You can build a matrix in a spreadsheet, on paper or in an app. For example, the mobile app Decision Maker: Smart Choices has a Compare Options feature where options are columns and criteria are rows. You rate each cell from 1 to 10 and the app calculates a weighted sum to highlight the winner. It also offers Pros & Cons, SWOT, a 10-10-10 rule and a Decision Tree, which was added in version 2026.09.21. Its store listings note in-app purchases, and the data-handling disclosures differ between the app stores, so check them before entering sensitive decisions.
Conclusion
A decision matrix turns a vague comparison into a structured one: define the options, choose measurable criteria, weight them, score, and total. Its main value is making your priorities explicit, which is what reduces second-guessing later.
Treat the result as a strong input rather than a verdict. If the totals are close or the winner feels wrong, that reaction is a signal to revisit your criteria and weights.