Overview
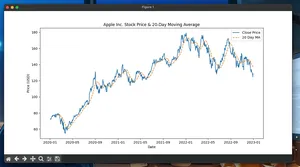
Moving Averages (MAs) smooth price data to reveal trend direction. The Simple Moving Average (SMA) is the arithmetic mean of the last N closing prices. In trading, SMAs help with trend detection, filter noise, and drive rules like moving-average crossovers.
Common MA types:
| Type | Smoothing | Lag | Typical Use |
|---|---|---|---|
| SMA | Uniform weights | Higher | Baseline trend filter, crossovers |
| EMA | Exponential weights | Lower | Faster response to new prices |
| WMA | Linearly weighted | Medium | Emphasize recent data without EMA curve |
This guide shows practical, concise ways to compute SMAs (and briefly EMAs) for algorithmic trading in Python.
Minimal working example (SMA with pandas)
import pandas as pd

# Sample daily closing prices
close = pd.Series(
    [100, 102, 101, 103, 104, 106, 105, 107, 108, 110],
    index=pd.date_range("2024-01-01", periods=10, freq="D"),
    name="Close",
)

# Compute SMAs
sma_3 = close.rolling(window=3, min_periods=3).mean()
sma_5 = close.rolling(window=5, min_periods=5).mean()

# Simple crossover signal: 1 when fast SMA > slow SMA, else 0
fast = sma_3
slow = sma_5
position = (fast > slow).astype(int)

# Identify buy/sell crossovers
buy = (fast > slow) & (fast.shift(1) <= slow.shift(1))
sell = (fast < slow) & (fast.shift(1) >= slow.shift(1))

print("SMA(3):\n", sma_3)
print("SMA(5):\n", sma_5)
print("Buy cross dates:", list(buy[buy].index))
print("Sell cross dates:", list(sell[sell].index))
What it does:
- Computes SMA(3) and SMA(5)
- Generates a simple trend-following position
- Reports crossover dates
Quickstart (real prices)
- Install packages
pip install pandas numpy yfinance
- Load historical prices
import pandas as pd
import numpy as np
import yfinance as yf

df = yf.download("SPY", start="2022-01-01", progress=False)[["Close"]]
- Compute SMAs and a crossover strategy
df["SMA_20"] = df["Close"].rolling(20).mean()
df["SMA_50"] = df["Close"].rolling(50).mean()

# Position: long when fast >= slow, flat otherwise
df["position"] = (df["SMA_20"] >= df["SMA_50"]).astype(int)

# Next-day execution to avoid lookahead
df["ret"] = df["Close"].pct_change()
df["strategy_ret"] = df["position"].shift(1) * df["ret"]

equity_curve = (1 + df["strategy_ret"]).cumprod()
print(equity_curve.tail())
- Inspect signals
cross_up = (df["SMA_20"] > df["SMA_50"]) & (df["SMA_20"].shift(1) <= df["SMA_50"].shift(1))
print("Recent buy signals:", list(cross_up[cross_up].index[-5:]))
- Persist results
df.to_csv("spy_sma_signals.csv")
Computing SMAs efficiently
pandas rolling (recommended):
series.rolling(window).mean()is C-optimized.- Use
min_periods=windowto avoid partial-window bias.
numpy convolution (fast, explicit control):
import numpy as np
import pandas as pd

# Assume Series `close`
window = 20
weights = np.ones(window, dtype=float) / window
sma_vals = np.convolve(close.values, weights, mode="valid")
sma = pd.Series(sma_vals, index=close.index[window-1:], name=f"SMA_{window}")
- Exponential MA (EMA) in pandas:
ema_20 = close.ewm(span=20, adjust=False).mean()
Choosing windows (practical)
- Intraday futures/FX: 20–50 bars (fast), 100–200 bars (slow)
- Daily equities: 20/50 (swing), 50/200 (trend), 10 (very fast)
- Crypto 24/7: consider 24, 72, 168 for hourly bars
- Use volatility-weighted sizing if mixing assets with different ATR
Rule of thumb: longer windows reduce whipsaws but increase lag.
Using SMAs in strategies
- Single-SMA filter: trade long only when price > SMA(N)
- Two-SMA crossover: long when SMA(fast) > SMA(slow)
- Breakout confirmation: require price cross and SMA slope > 0
- Risk control: exit when price closes below SMA or when fast < slow
Example: SMA slope filter
sma_50 = df["Close"].rolling(50).mean()
slope_up = sma_50 > sma_50.shift(5)  # 5-bar slope proxy
signal = (df["Close"] > sma_50) & slope_up
Pitfalls and how to avoid them
- Lookahead bias: never use today’s signal to trade today’s close. Shift positions by 1 bar.
- NaNs at start: the first
window-1values are NaN. Handle withmin_periodsor drop them. - Missing days/timezones: align calendars when merging assets. Resample consistently.
- Split/dividend adjustments: ensure close prices are adjusted; unadjusted data distorts MAs.
- Parameter fishing: windows tuned on past data may overfit. Use walk-forward or nested CV.
- Data snooping via price source: mixing data vendors can introduce micro-differences; stick to one.
- Execution slippage: backtests ignoring fees/slippage inflate results; simulate costs.
Performance notes
- Vectorize: avoid Python loops. Use pandas rolling or numpy convolution.
- Memory: prefer
float32for very large datasets to halve memory footprint. - Large windows: for very long windows or many assets, convolution can be faster; consider FFT-based convolution (e.g., SciPy) for huge kernels.
- Batch compute: process arrays shape (time, assets) with numpy for multi-asset universes.
- I/O bottlenecks: store OHLCV as Parquet; read selectively (columns=["Close"]).
- Parallelism: compute per-symbol in parallel processes when I/O bound; rolling mean itself is fast and often CPU-light.
Testing correctness
- Known-sequence check: for prices 1..N, SMA(N) at the last bar equals the average of 1..N.
- Equivalence: pandas rolling mean should match numpy convolution aligned to the right edge.
- Edge cases: constant series returns constant SMA; alternating series will lag by half-period.
Tiny FAQ
Q: SMA vs EMA for crossovers?
- A: EMA reacts faster (less lag), but may whipsaw more. SMA is smoother and simpler.
Q: How to avoid delayed entries?
- A: Use shorter windows, EMAs, or confirm with momentum; trade on next bar’s open to avoid lookahead.
Q: Can I use volume-weighted price for SMA?
- A: Yes. Compute typical price (H+L+C)/3 or VWAP-like inputs before averaging if it fits your logic.
Q: How many bars do I need before using an SMA?
- A: At least
windowbars. Many practitioners also require an additional buffer (e.g., 2×window) before trusting signals.
- A: At least
Summary
- Use pandas
rolling(...).mean()for SMAs; it’s fast and reliable. - Shift signals by one bar to avoid lookahead.
- Choose windows based on timeframe and tolerance for lag/whipsaws.
- Validate with simple tests and track performance with an equity curve.


