Table of Contents
Overview
Free daily stock OHLCV data is sufficient for many backtests and signals. This guide shows practical Python options, minimal code to fetch data, and tips to keep downloads reliable and fast. Always review each provider’s terms of service and rate limits, and validate data before using it in live trading.
Focus: Python, daily bars, free sources suitable for research and backtesting.
Quickstart
- Pick a source:
- Yahoo Finance via yfinance (no key, unofficial, popular)
- Stooq via pandas-datareader (no key, historical daily)
- Alpha Vantage (free API key, adjusted prices)
- Install packages:
- pip install yfinance pandas pandas-datareader alpha_vantage
- Fetch a ticker’s daily bars (see examples below).
- Normalize columns and order by ascending date.
- Validate: check trading calendar, missing dates, splits/dividends.
- Cache to disk (Parquet) and respect provider rate limits.
Minimal working example: Yahoo Finance (yfinance)
# pip install yfinance pandas
import yfinance as yf
import pandas as pd

# Download 5 years of daily OHLCV with split/dividend adjustment
# auto_adjust=True returns prices adjusted for splits and dividends
bars = yf.download(
    tickers="AAPL",
    period="5y",
    interval="1d",
    auto_adjust=True,
    progress=False,
)

# Ensure chronological order
bars = bars.sort_index()

# Rename columns (already standard: Open, High, Low, Close, Adj Close?, Volume)
# With auto_adjust=True, Close is adjusted and Adj Close is omitted.

# Compute daily returns
bars["ret"] = bars["Close"].pct_change().fillna(0)

# Save for reuse
bars.to_parquet("aapl_yf_daily.parquet")
print(bars.tail())
Notes:
- yfinance is unofficial; data may be delayed, incomplete, or revised.
- auto_adjust=True simplifies backtesting with total-return prices.
Alpha Vantage: adjusted daily via SDK
# pip install alpha_vantage pandas
from alpha_vantage.timeseries import TimeSeries
import pandas as pd

ts = TimeSeries(key="YOUR_ALPHA_VANTAGE_KEY", output_format="pandas")
# 'compact' ~ last 100 data points; 'full' returns the full history
raw, meta = ts.get_daily_adjusted(symbol="AAPL", outputsize="full")

# Columns like '1. open', '2. high', ..., '5. adjusted close'
# Sort ascending date and simplify column names
bars = raw.sort_index()
bars.columns = [c.split(". ")[1].replace(" ", "_") for c in bars.columns]
# Keep standard fields
bars = bars[["open", "high", "low", "close", "adjusted_close", "volume"]]

# Use adjusted_close for total-return backtests
bars["ret"] = bars["adjusted_close"].pct_change().fillna(0)
print(bars.tail())
Notes:
- Requires API key. Free tier has per-minute and daily caps; throttle requests.
- Provides both raw and adjusted prices, plus split/dividend info.
Stooq via pandas-datareader
# pip install pandas-datareader pandas
import pandas_datareader.data as web

# Stooq returns columns: Open, High, Low, Close, Volume
bars = web.DataReader("AAPL", "stooq")
# Stooq often returns descending dates; sort ascending
bars = bars.sort_index()

print(bars.tail())
Notes:
- No API key. Great for quick daily historical downloads.
- Coverage can vary by exchange and ticker symbol format.
Batch downloads and symbol hygiene (yfinance)
import yfinance as yf
import pandas as pd

symbols = ["AAPL", "MSFT", "SPY"]
raw = yf.download(symbols, period="3y", interval="1d", auto_adjust=True, progress=False)
# MultiIndex columns: level 0 = field, level 1 = ticker
# Reorder to tidy long format for analysis
stacked = (
    raw.stack(level=1)
       .rename_axis(["date", "symbol"])  # index names
       .reset_index()
)
# stacked columns: ['date','symbol','Open','High','Low','Close','Volume']

# Optional: align to a trading calendar by forward-filling only within each symbol
stacked = stacked.sort_values(["symbol", "date"])  # no fill here, just ordering

stacked.to_parquet("daily_yf_multi.parquet")
print(stacked.tail())
Choosing a free source: quick comparison
| Source | Python access | Auth | Adjusted prices | Notes |
|---|---|---|---|---|
| Yahoo Finance | yfinance | No | Yes (option) | Unofficial; rate limits implicit |
| Stooq | pandas-datareader (stooq) | No | Close only | Solid historical daily; desc sort |
| Alpha Vantage | alpha_vantage SDK or requests | Yes | Yes | Free tier caps; dividends/splits |
| Finnhub | finnhub-python | Yes | Varies | Free tier limited; intraday too |
| FMP | requests / community SDKs | Yes | Varies | Some endpoints free; caps apply |
Tip: Start with yfinance or Stooq for prototypes; switch to a keyed API for stability, metadata, and clear rate limits.
Common pitfalls
- Adjusted vs unadjusted: For backtests, prefer adjusted prices (split and dividend adjusted). Alpha Vantage exposes adjusted_close; yfinance can auto-adjust.
- Ticker symbols: Different vendors use different tickers (e.g., BRK.B vs BRK-B). Verify mapping per source.
- Delistings and survivorship bias: Free feeds often omit delisted tickers. Backtests may be biased upward.
- Holidays and partial days: Calendars differ by exchange. Don’t forward-fill across non-trading days when computing returns.
- Timezones: Daily bars may be stamped in UTC or local exchange time. Normalize before joins.
- Revisions: Some providers revise data. Cache with versioning; log retrieval dates and sources.
- Rate limiting: Batch requests, add sleeps/retries, and handle HTTP errors gracefully.
Performance notes
- Batch tickers: Use yfinance.download with lists to reduce overhead.
- Caching: Save to Parquet/Feather; re-read locally rather than re-downloading.
- Incremental updates: Append only new dates instead of refetching full history.
- Parallelism: For keyed APIs with strict per-minute limits, prefer sequential with backoff; for unkeyed, limit concurrency to avoid bans.
- Memory: Keep only needed columns (Open, High, Low, Close, Volume, Adjusted) and downcast dtypes where safe.
- I/O: Use gzip-compressed Parquet; it’s compact and fast to read.
Example: tiny cache helper
import pathlib, pandas as pd, yfinance as yf

CACHE = pathlib.Path("cache"); CACHE.mkdir(exist_ok=True)

def load_daily_yf(symbol: str) -> pd.DataFrame:
    path = CACHE / f"{symbol}.parquet"
    if path.exists():
        return pd.read_parquet(path)
    df = yf.download(symbol, period="max", interval="1d", auto_adjust=True, progress=False).sort_index()
    df.to_parquet(path)
    return df
Validation checklist
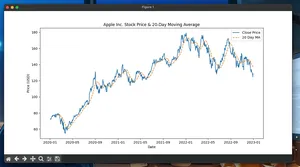
- Visual sanity check of OHLC ranges and volume spikes.
- Compare last close across two sources on a sample date.
- Verify cumulative return continuity around split/dividend events.
- Ensure no duplicated or future-dated rows.
Tiny FAQ
- Can I use this data for live trading? It’s fine for research; for production, consider paid, SLA-backed feeds.
- How do I get adjusted prices? Use yfinance with auto_adjust=True or Alpha Vantage’s adjusted_close.
- Why are dates descending from Stooq? Sort by index ascending after download.
- Do I need an API key? yfinance and Stooq do not; Alpha Vantage, Finnhub, and many others require keys.
Reminder
This article is for engineering guidance on data access. It is not investment advice. Always follow each provider’s terms and rate limits.